“It is not the amount of knowledge that makes a brain. It is not even the distribution of knowledge. It is the interconnectedness.”
– James Gleick, The Information: A History, a Theory, a Flood
We live in an age of information abundance. It’s been over a decade since cloud computing services revolutionized data storage and collection, and SaaS applications enabled enterprises to leverage that data at scale. Now we are entering a new age of enterprise transformation, led by the development and deployment of Large Language Models (LLMs). Alongside this new technology, there are new demands being put on organizations, as these systems require more than just data in order to run: these new systems require knowledge.
The enterprise software platforms of the past decade have all been information systems. CRMs, BI tools, HR software, financial planning and project management applications all process and display an organization’s data as usable information. The promise of AI and intelligent software is that these systems can do much more than their predecessors. Intelligent software can provide insights, take actions and complete entire workflows for users; perhaps one day they will even work autonomously alongside employees as co-workers themselves. Given the seismic difference in functionality, it makes sense that a new level of preparation is now required of organizations in order to effectively leverage intelligent software, but how do we make the jump? How does an organization move from utilizing systems of information to systems of knowledge?
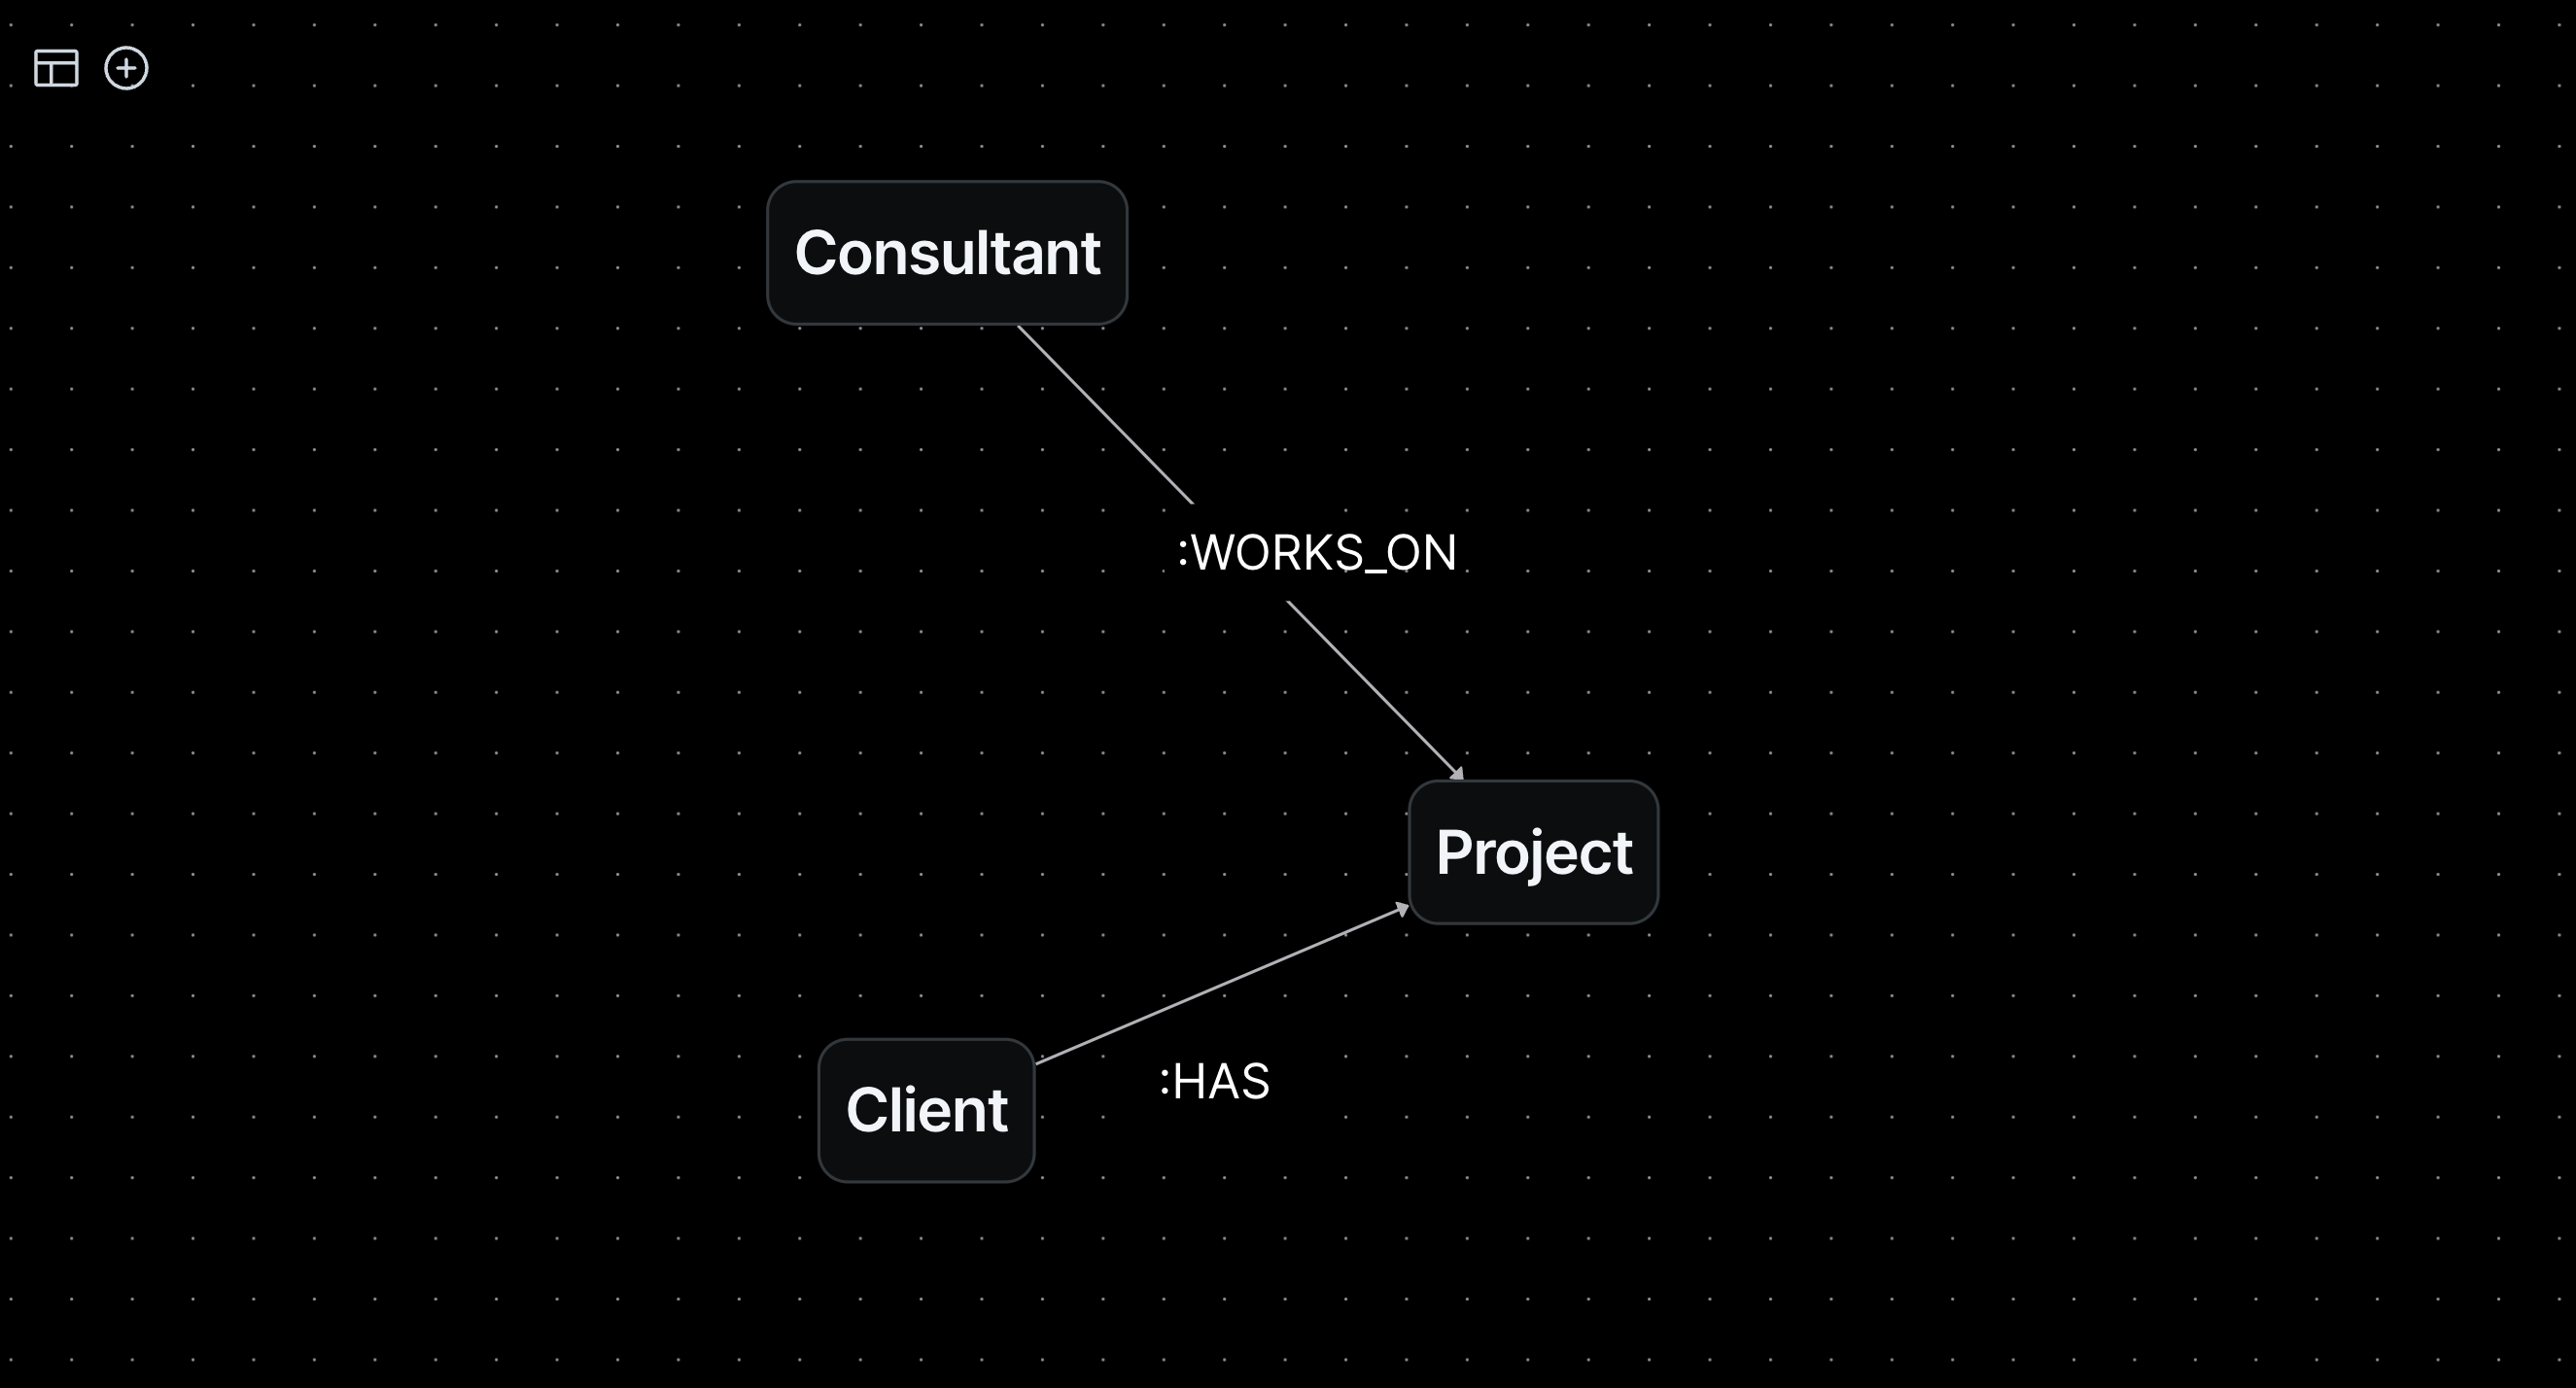
The answer is the knowledge graph. A knowledge graph is a digital representation of organizational knowledge, its real-world entities and relationships. Entities range from objects and events to concepts. For example, a few entities in a consultancy’s knowledge graph would be clients, consultants and projects. Relationships are the layers of context and meaning between these entities. In the consultancy’s knowledge graph, its relationships would show that clients have projects, and consultants work on projects. We represent entities as nodes and relationships as edges:

Bartleby.dev Client Portal
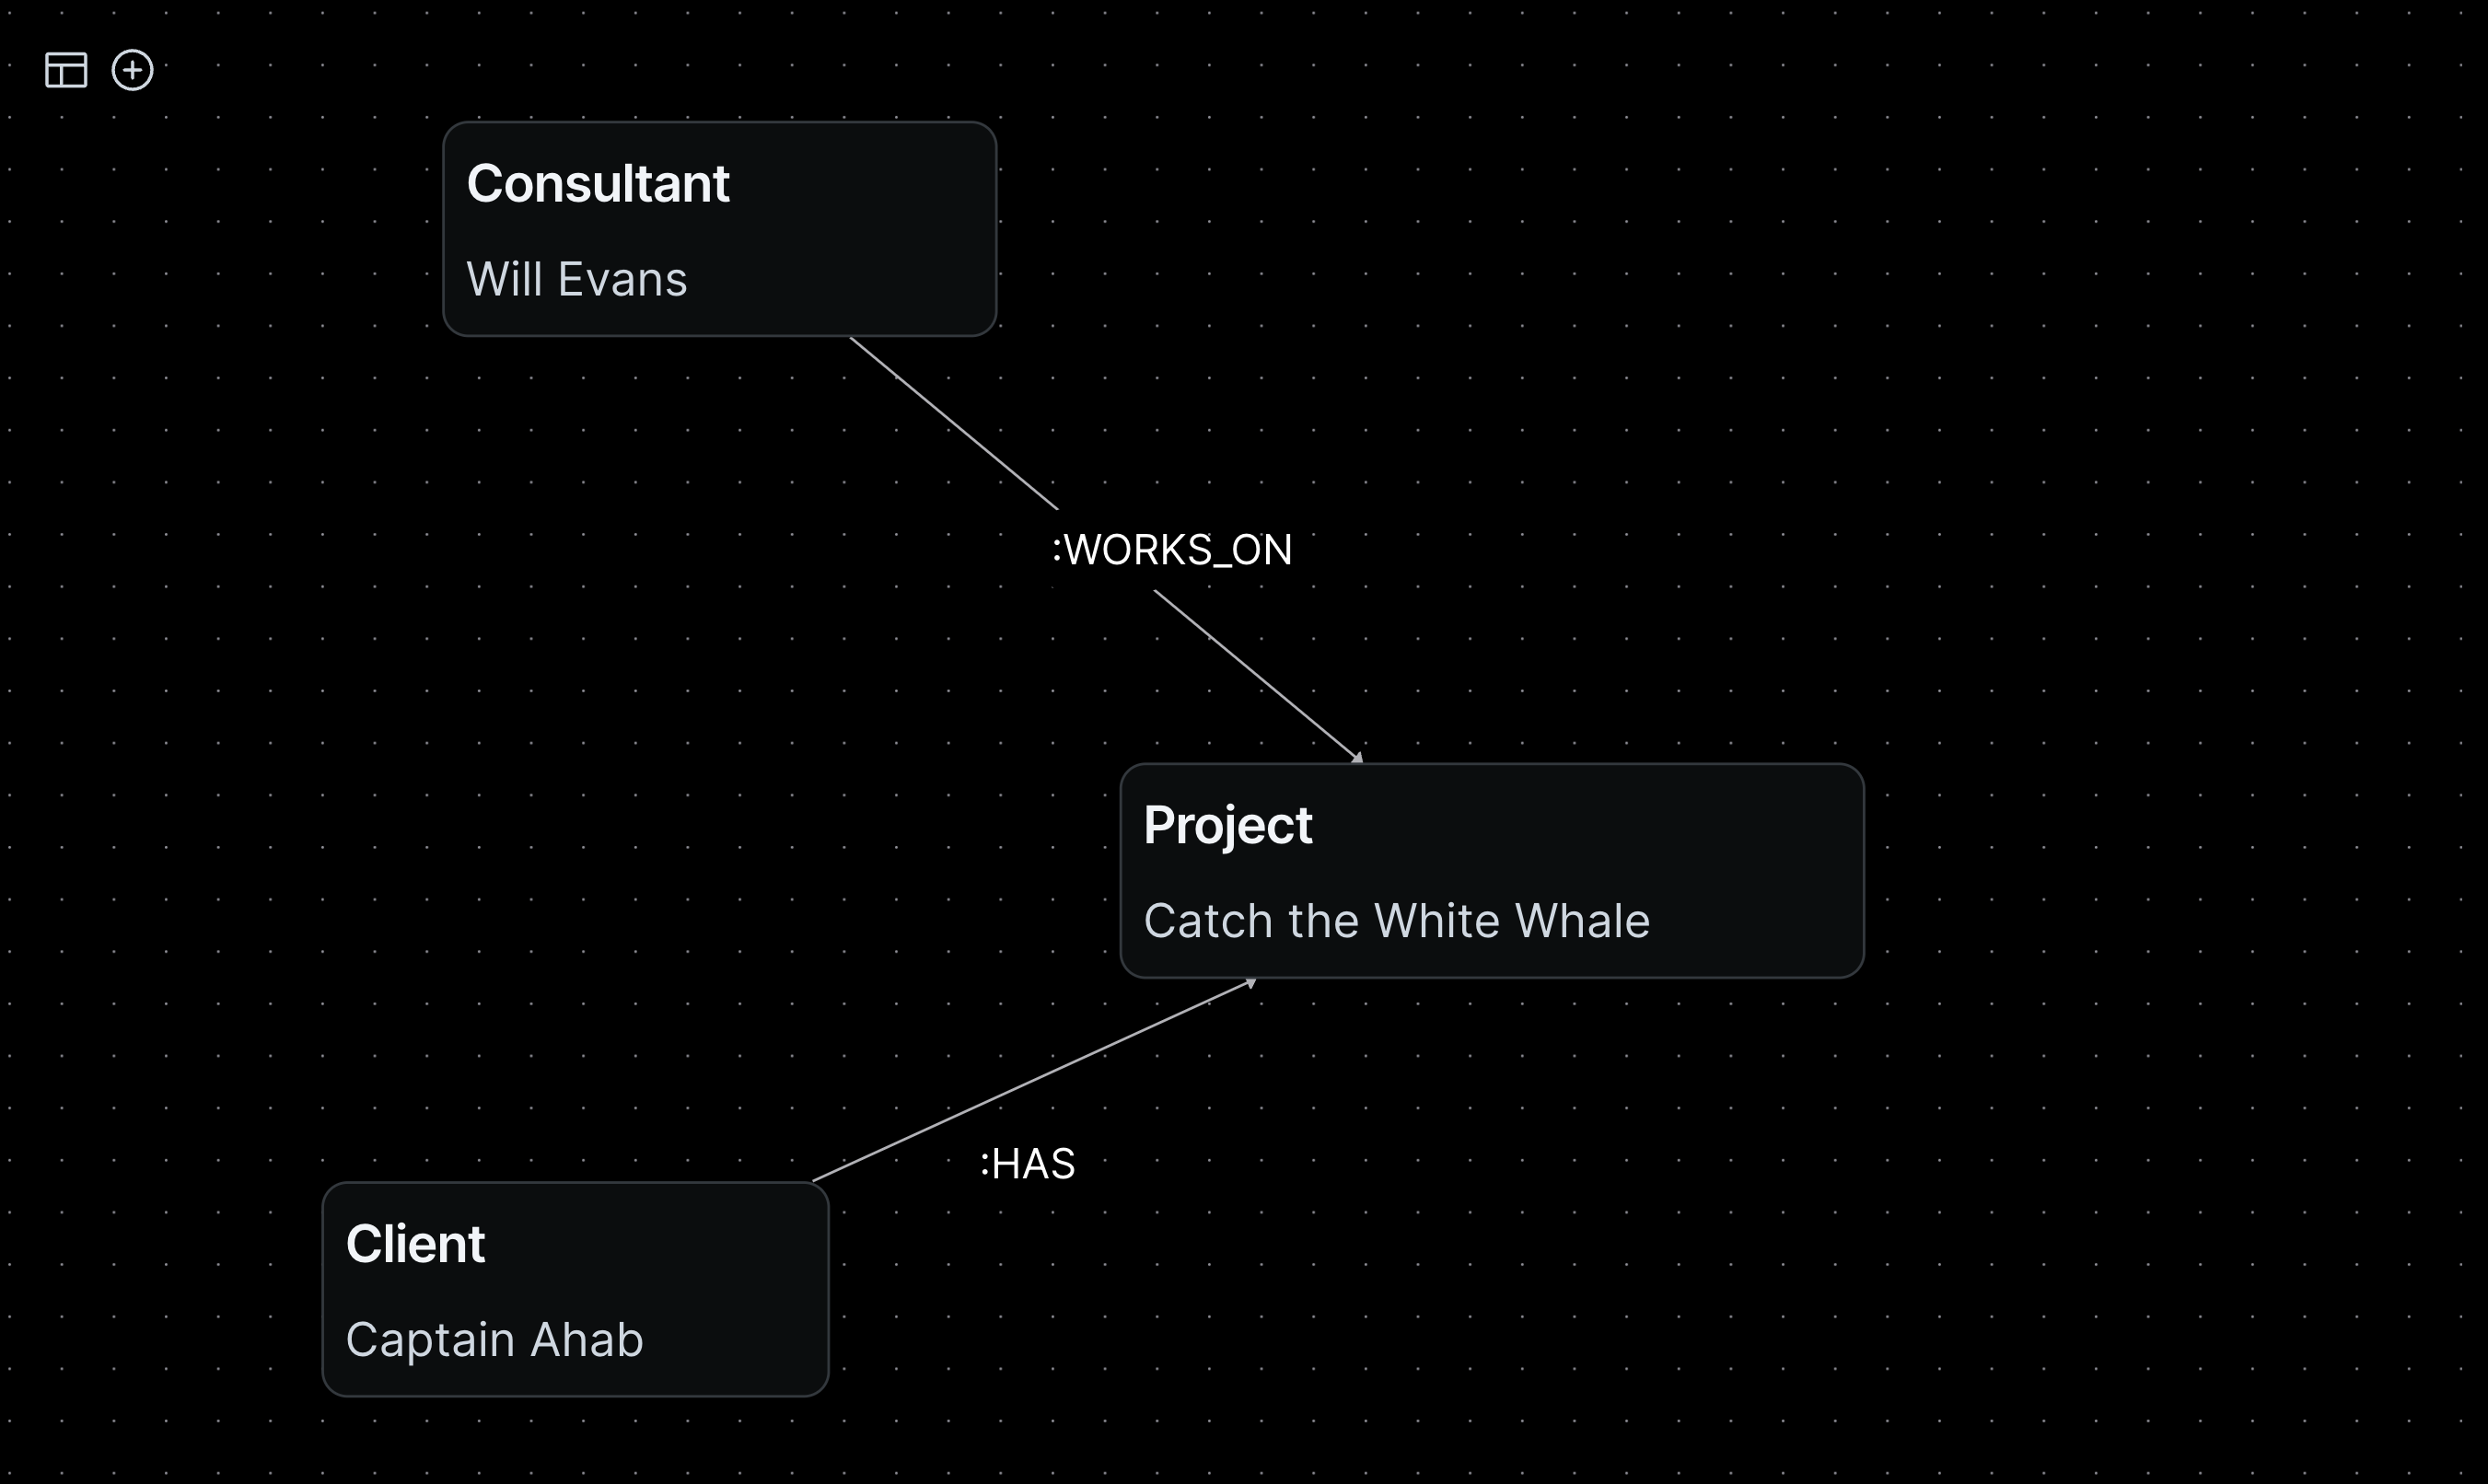
The graph schema above is called an ontology. An ontology models all of the categories that entities and relationships can take in a knowledge graph and serves as the graph’s data schema or organizing framework. Ontologies are powerful for the same reason that knowledge graphs are: they digitally display semantic knowledge in natural language. As the blueprint for an organization’s knowledge, ontologies provide precise specifications for populating entities and relationships, and in doing so, provide a link and scalable communication framework between human and machine. Below is an example of how we could populate our above schema with our organization’s information to build a simple knowledge graph:

Bartleby.dev Client Portal
The information that you populate your knowledge graph with can come in the form of structured or unstructured data. Structured data is standardized data that comes with a predefined schema, such as names and emails from a spreadsheet or database table. Unstructured data has no predefined format and comes from a variety of sources, like zoom recordings, email messages and word documents. The reason why it is important that a knowledge graph utilizes both types of data is because the context and meaning required to turn information into knowledge often comes from leveraging unstructured data.
We’ll use an example from our own organization to illustrate our point. When working on a project for a client, we follow a set of tasks that are outlined in our project plan. These tasks can exist in a few different states: completed, in progress or backlog. If a task has been in progress for a long time, it could be presenting some unexpected challenges for our engineers. These challenges are most often discussed on morning standup Zoom calls. By loading the Zoom recordings, or unstructured data, into our knowledge graph alongside our structured task data, we enrich our task with context about the challenges hindering its completion. We move from simply displaying information about the task to displaying a digitized awareness, or knowledge, of the task.
In our next piece, we will walk through how to leverage this type of knowledge to power intelligent workflows and applications, but first, let’s discuss how to get started building your own knowledge graph. There are a couple of different options to choose from when implementing a knowledge graph. The first option is to use a graph database, such as Neo4j or Memgraph. Graph databases enable both data and information storage as well as querying your knowledge graph in one solution. For organizations that aren’t interested in taking the graph database route or have their own existing relational databases, we would recommend the second option of using a graph processing engine. Graph processing engines sit on top of your existing data infrastructure and provide the ability to query your knowledge graph via their interface. PuppyGraph is an example of this type of solution. Both routes are viable options. It is worth evaluating your organization’s existing storage needs and preferences when choosing the best way to build your knowledge graph.
Interested in developing a custom ontology and knowledge graph for your organization? Reach out, we’d love to hear from you.